Solutions / Reports and analytics
Reports and analytics
Numbers you can act on, explained in plain words
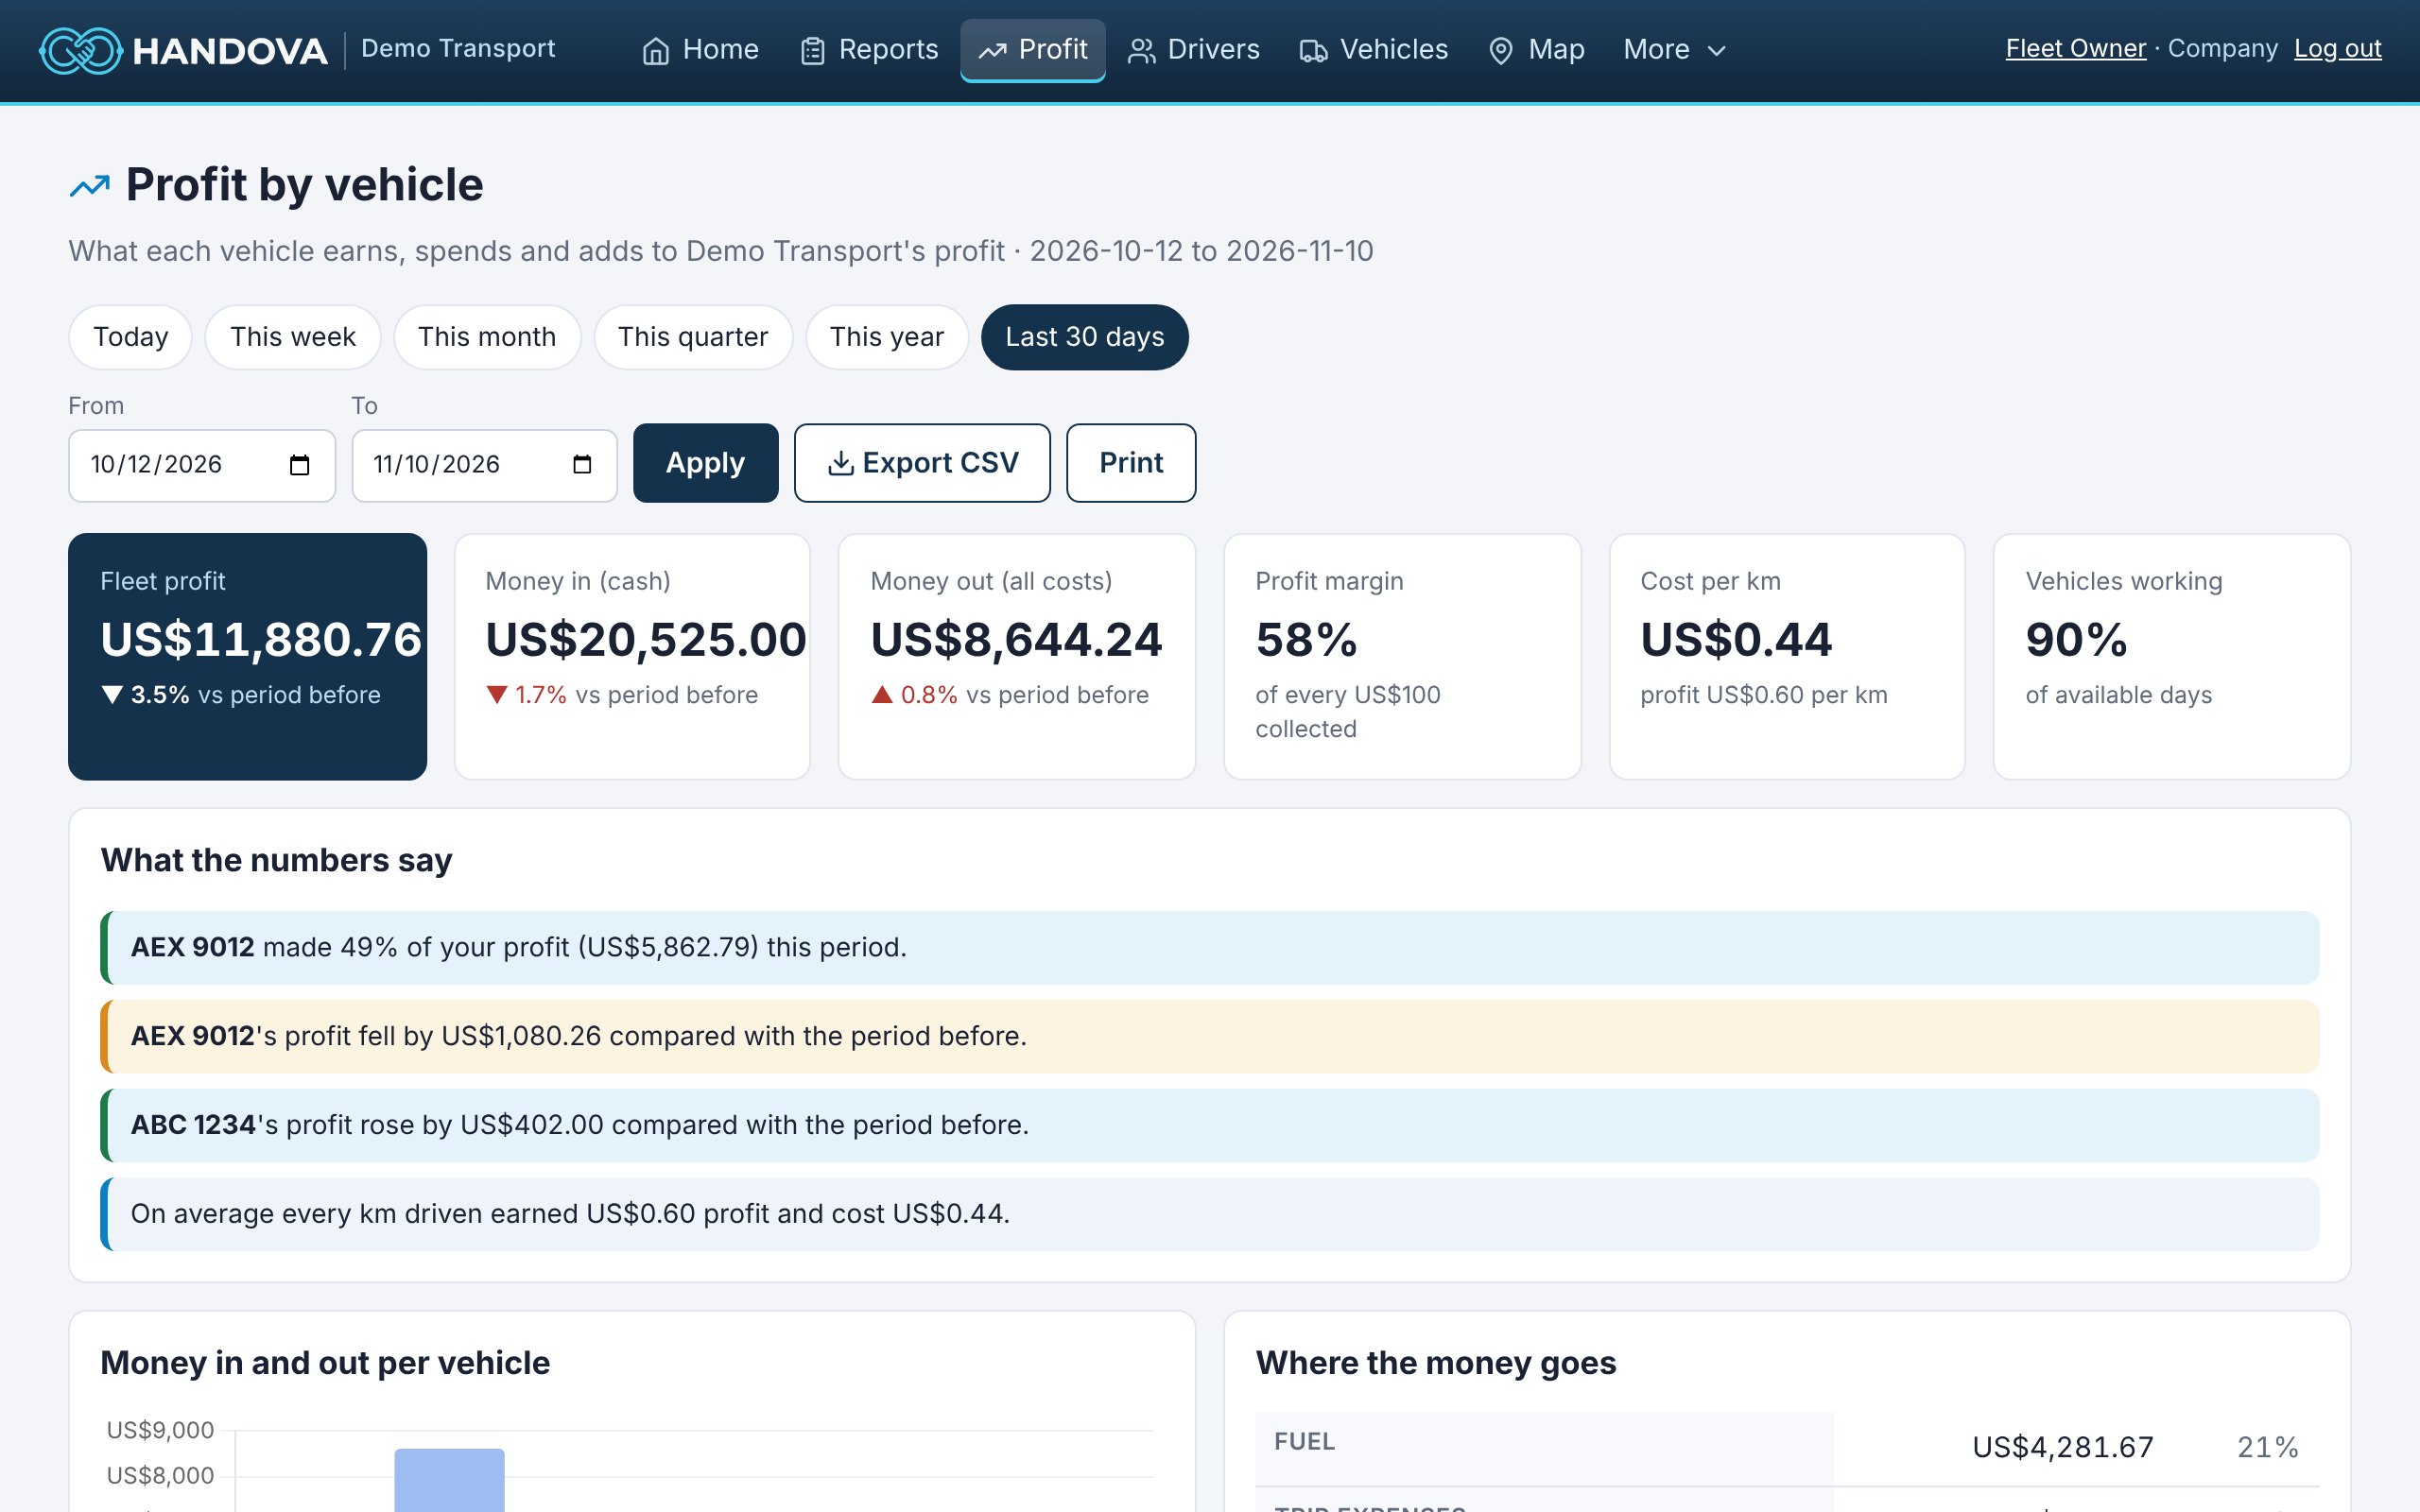
Profit by vehicle, machine and driver for any period, compared with the period before, with insights that tell you what changed and why.
Included from the Starter (free) plan
What you get
Reports and analytics in Handova
Profit by asset
Income, costs, profit, margin and share of company profit for every vehicle or machine.
Running costs
Insurance, loans, wages, licences and trackers spread fairly over each day.
Break-even and payback
How many working days each asset needs to cover its costs, and when it has paid back its price.
Insights
Handova points out which assets made most of your profit, which lost money, and why.
Any period
Today, week, month, quarter, year or your own dates, compared with the period before.
CSV export
Download reports and profit tables for your accountant or spreadsheet.
How it works
Ready in three steps
- 1
Drivers send their daily handovers.
- 2
Add running costs on each vehicle page.
- 3
Open Profit to see every asset for any period.
Questions
Common questions
Which currency are reports in?
Your company's currency, chosen when you register.
Can my accountant get the data?
Yes. Export any report as CSV.
Can I see one driver's results?
Yes. Reports and dashboards can be filtered by driver and vehicle.
Also in Handova
Works together with
Fuel management
Litres or gallons and money spent on fuel in every report, the fuel level at the start of every shift, and fuel cost per…
Learn moreFleet management
Vehicles, machines and other assets, the people who use them and the money they make, in one place. For a single taxi or…
Learn moreDriver management
Drivers join with your company code, start each shift with a safety check and hand over cash, fuel and expenses from the…
Learn moreReady to see what your fleet really earns?
Founding customers get Standard free for 3 months. Already using Handova? Log in to your account.